Research Areas
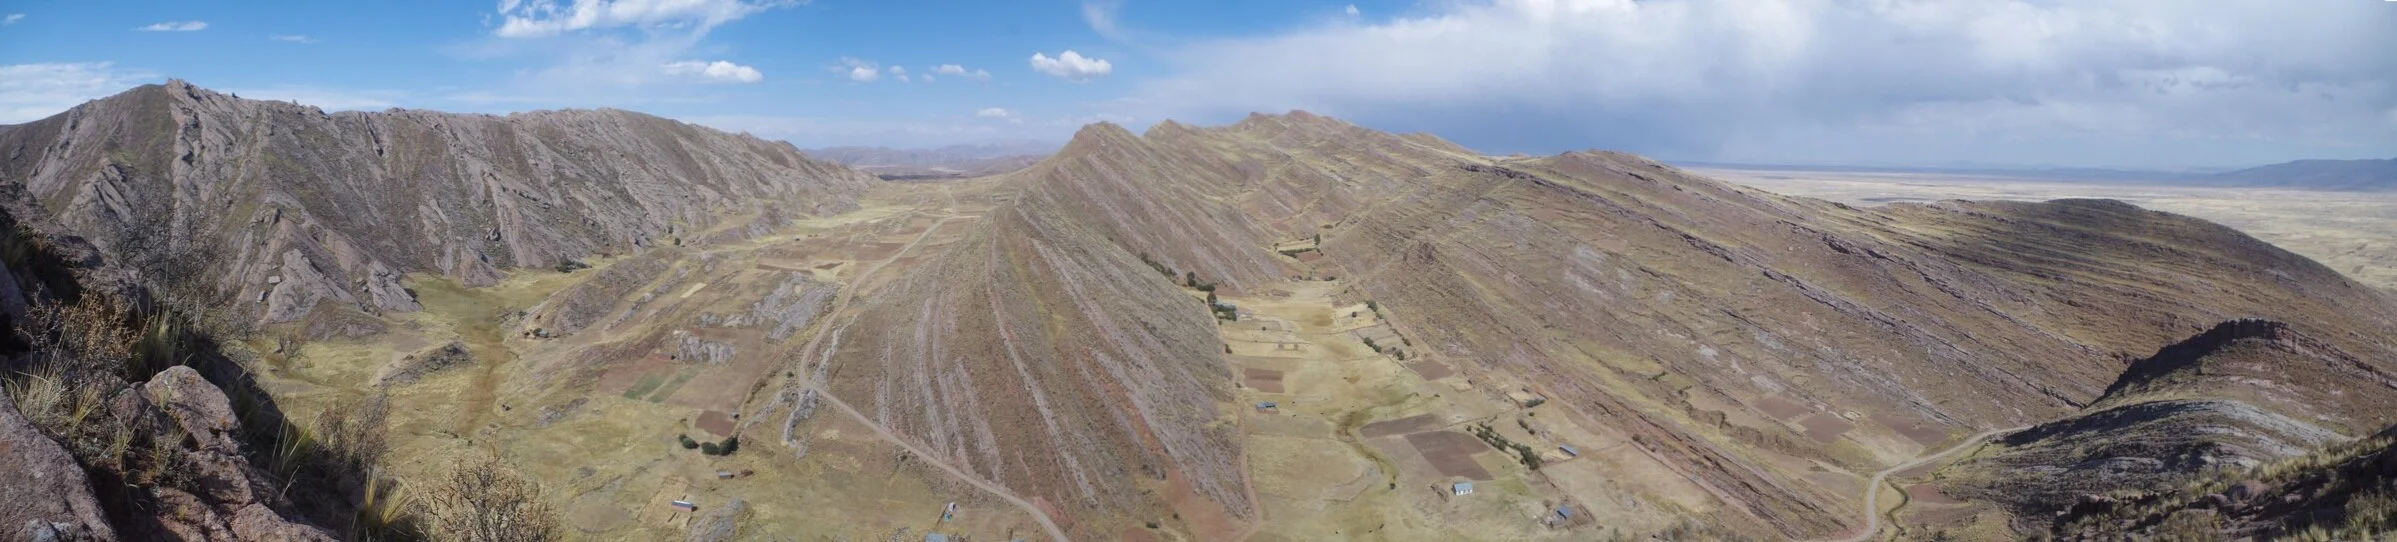
Paleoaltimetry
My team uses a combination geological observations, isotopic analysis, and numerical modelling to reconstruct the elevation of mountain belts through time.

(Left) Paleoelevation reconstruction for the Peruvian Altiplano from Sundell et al. (2019) based on hydrogen isotopes in volcanic glass.
Panel A shows a map-view reconstruction of paleoelevation through time.
Panels B and C show cross-section reconstructions.
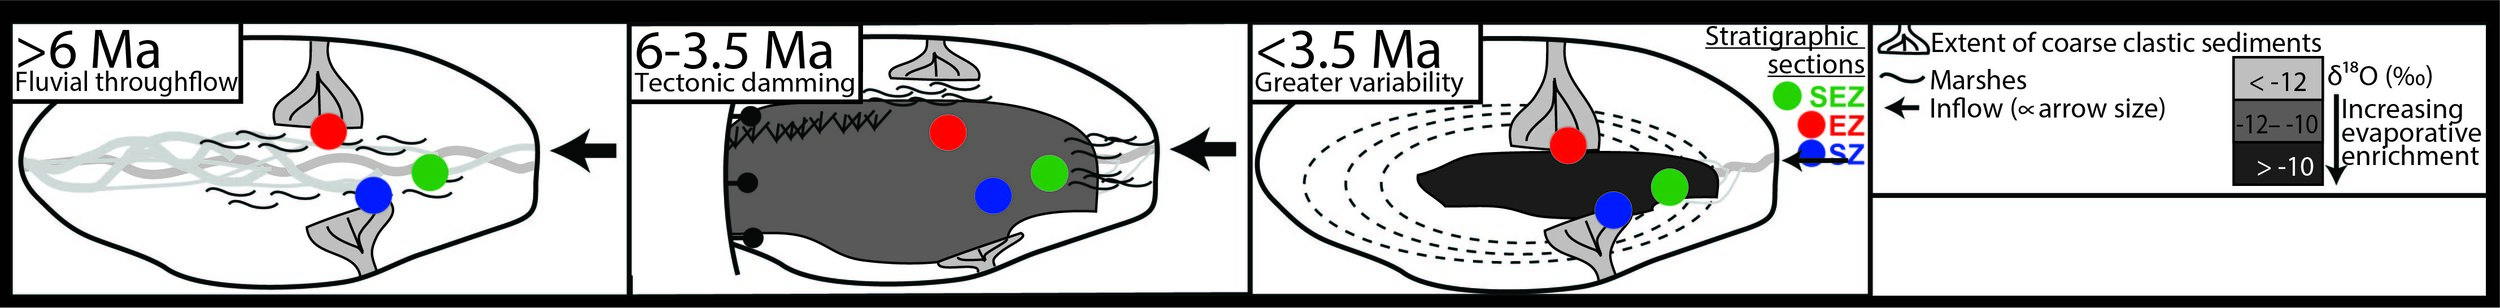
Paleoclimatology
My team uses field observations and isotopic and geochemical analysis to document changes in climate and environmental conditions that accompany changes in surface elevation.

(Left) Changes in oxygen isotopes, and grain size reported by Saylor et al. (2016) suggest a decrease in size of paleo-Lake Zhada on the Tibetan Plateau after ~3.5 Ma (panels A and B, left, and below). At the same time, stable isotope data and paleotemperatures indicate a decrease in surface elevation of the Tibetan Plateau (panel C, left). Numerical models show that a decrease in surface elevation may result in a weaker Indian Summer Monsoon which would result in a decrease in lake size.
Tectonic basin analysis
Using a combination of field observation, sediment provenance analysis, and numerical modeling we tackle questions regarding the tectonic and geodynamic mechanisms of basin formation.
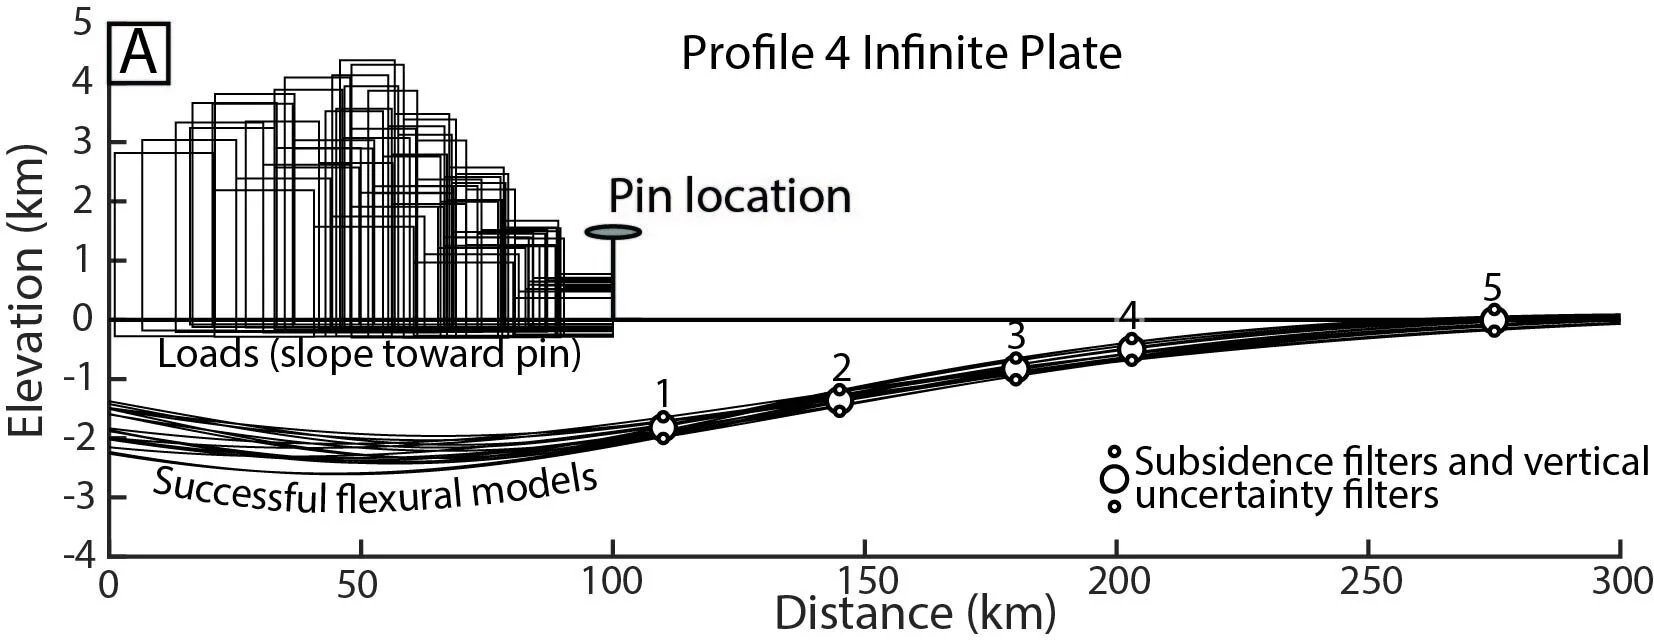
(Left) Effective elastic thickness and load height can be determined using a Monte Carlo forward model constrained by known stratigraphic thicknesses (example from Saylor et al., in review).
(Right) Paleogeographic reconstruction of the Colombian Magdalena Valley, Eastern Cordillera, and Llanos Basin through the Paleogene (from Saylor et al., 2011)

Quantitative sediment provenance analysis
My team uses cutting-edge numerical techniques to compare and model detrital geochronology data sets to determine the sources of sediment through time. We make these techniques available to the scientific community as free code and graphical user interface-enabled software.
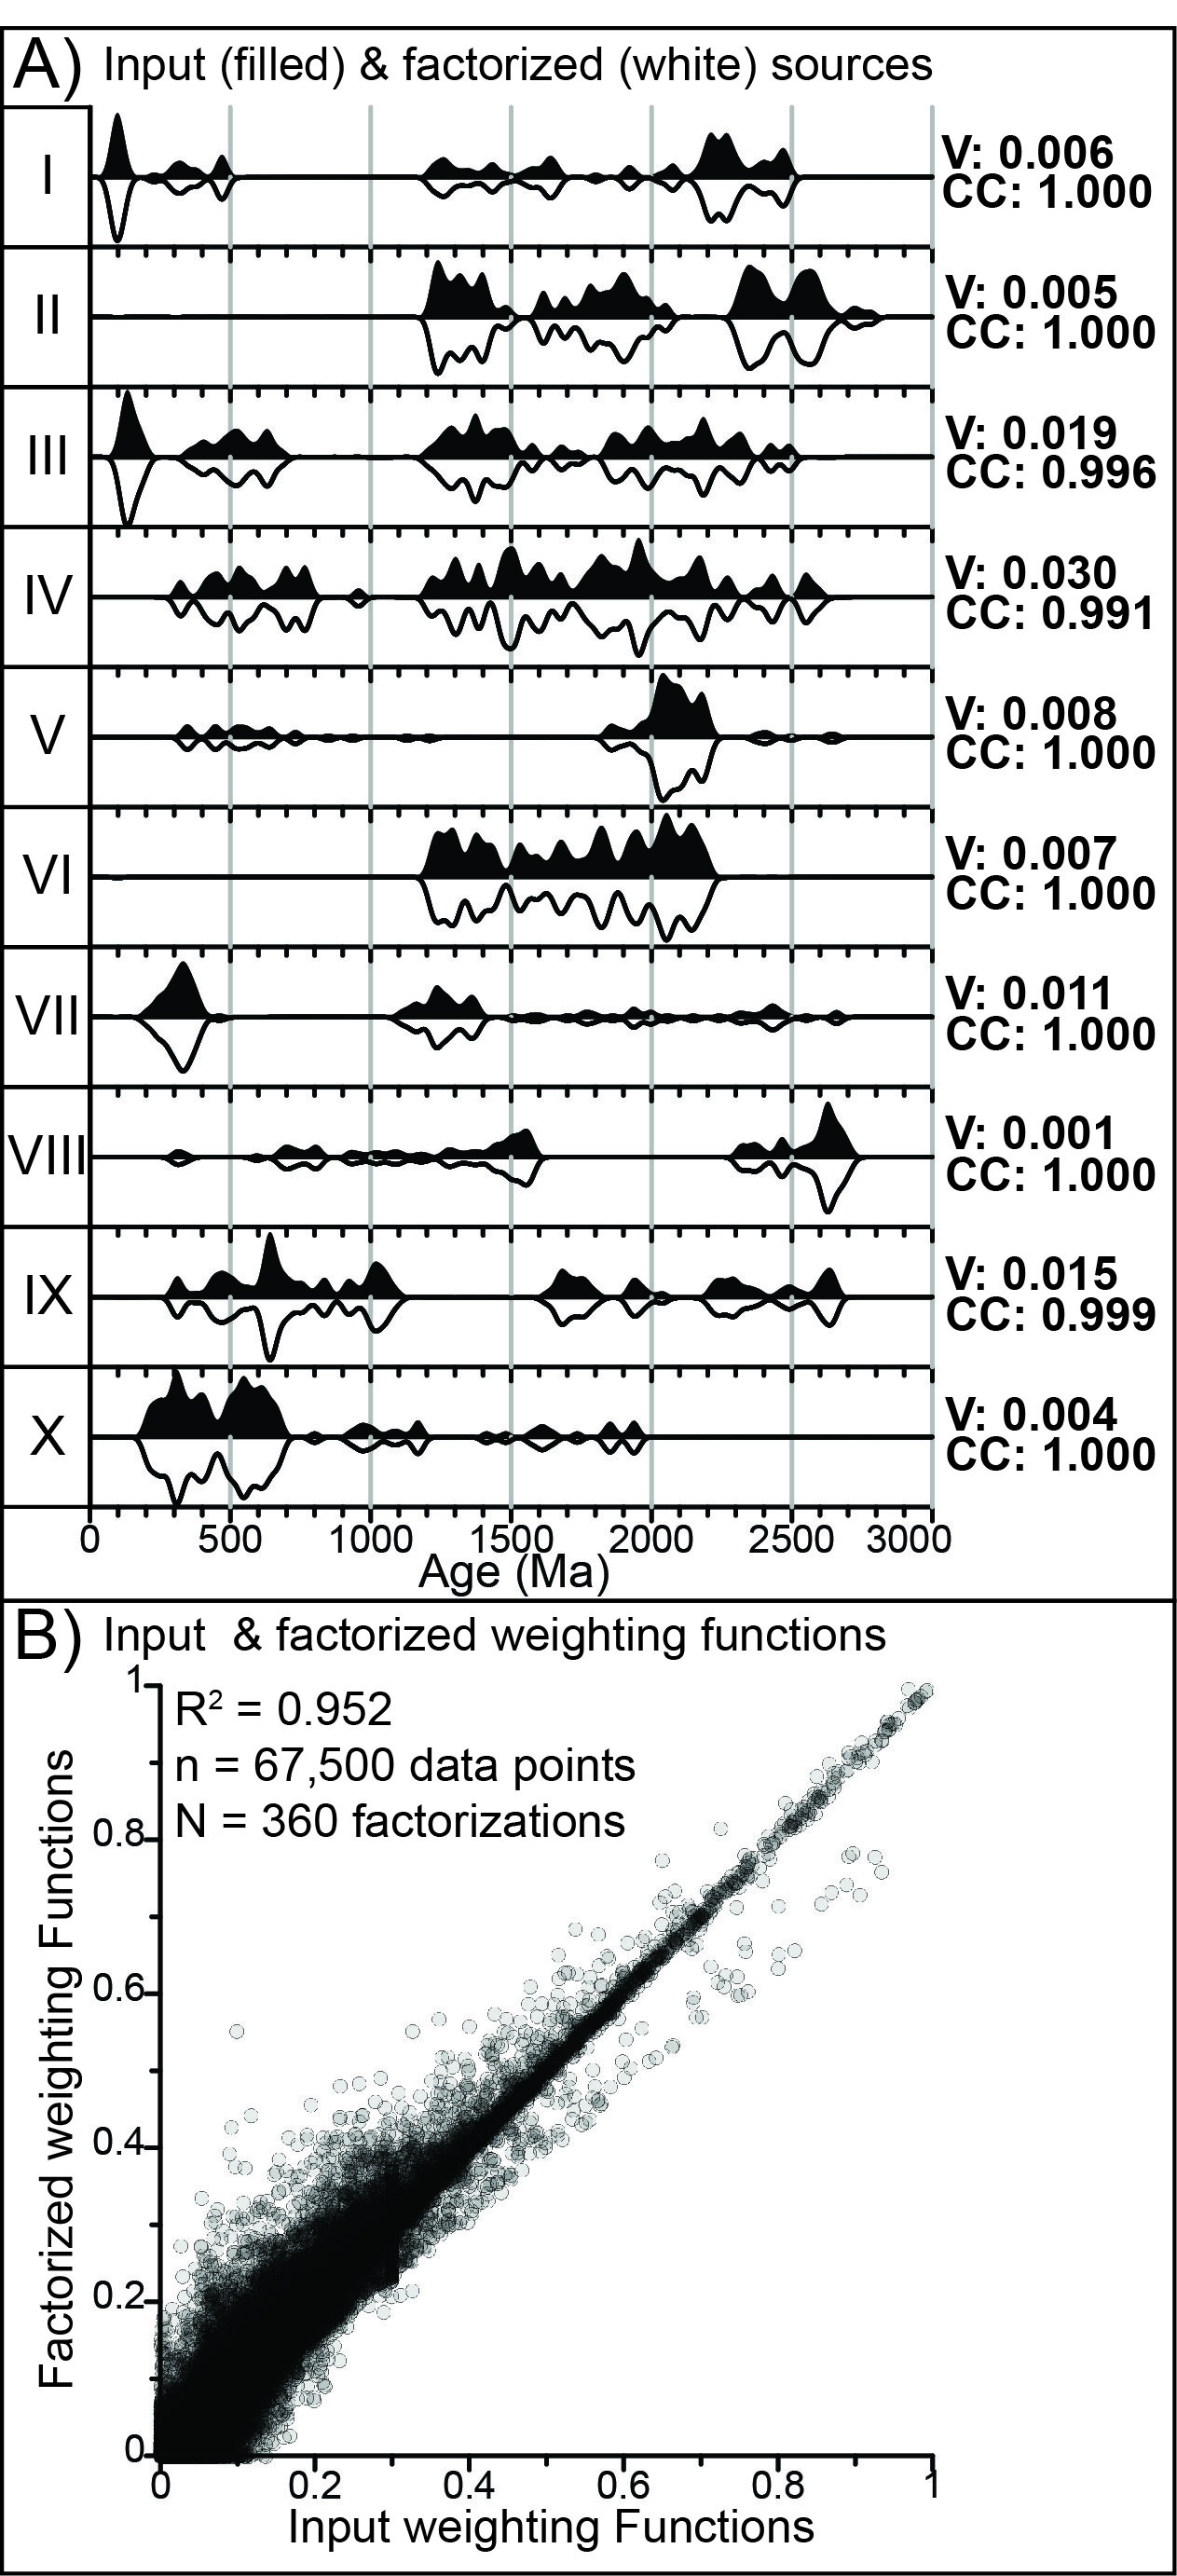
(Left) Non-negative matrix factorization of a model detrital zircon data (from Saylor et al., 2019).
Panel A shows the input distributions of ages as black-filled kernel density estimates and the recovered age distributions as inverted white-filled kernel density estimates. Quantitative comparison metrics (Kuiper V value and cross-correlation coefficient) show that the input and recovered data are indistinguishable.
Panel B shows the input and recovered mixing proportions. Input and recovered mixing proportions lie along a 1:1 line, showing that input mixing proportions are successfully recovered by the model.